
Status
See how a server stands: what runs, what waits in the queue and why, your limits, the activity in your repositories, what past tasks took, what waits for an approval, and the CPU and memory the runs take.
A server runs a few runs at a time and queues the rest. Everything on this page is in the
dashboard of a server with endpoints, too. When a run of yours does not start,
hammerkit remote status says why: every place is taken, you are at your own limit of
running runs, another run works on its sandbox, or it waits for an approval. Each of your
limits lists the runs that count against it, so you know which one to stop.
$ hammerkit remote status
build: signed in as alice
places: 4 of 4 taken (runs.maxConcurrent)
  run_a8Zt0pQw3mVx7yLc  test, lint  since 2026-11-07T10:01:12.000Z, 6m 2s
  run_c2Lk9sDe4rTy6uIo  build  since 2026-11-07T10:05:40.000Z, 1m 34s
  run_Hn3bV6cX9zL2kJ5g  e2e of bob  since 2026-11-07T10:02:03.000Z, 5m 11s
  1 run of others
queue: 2
  1. run_f1Gh5jKl8zXc3vBn  deploy  waiting 2m 10s  waits: your limit of running runs, 2 of 2 (runs.limits.running)
  2. run_Pq8wE2rT5yU1iO4p  lint of bob  waiting 40s  waits: no free place, 4 of 4 taken (runs.maxConcurrent)
waiting for an approval: 1 of at most 100
  run_k9Qw2eRt5yUi8oPa  e2e  needs op-payments-prod until 2026-11-07T11:42:00.000Z
service runs: 2 of 20 places taken on the server
  run_Vd1rX9pQ2mT7wN4a  up  feature-login: up web  until 2026-11-09T10:12:00.000Z, sleeps at 2026-11-07T10:42:00.000Z
    web:8080  https://feature-login-8080-3fa2c1e09b7d.run.example.com
  run_Ws8tY3uI6oP1aS4d  asleep  feature-cart: up web  until 2026-11-08T09:00:00.000Z
your limits:
  running   2 of 2    run_a8Zt0pQw3mVx7yLc, run_c2Lk9sDe4rTy6uIo  full
  queued    1 of 20   run_f1Gh5jKl8zXc3vBn
  approval  1 of 10   run_k9Qw2eRt5yUi8oPa
  services  1 of 3    run_Vd1rX9pQ2mT7wN4a
  asleep    1 of 10   run_Ws8tY3uI6oP1aS4d
capacity: 3 nodes with 12 CPU, 45 GiB, 4.1 CPU, 19 GiB in use
  runs: 14 pods, requested 5.25 CPU, 11 GiB, in use 2.8 CPU, 7.4 GiB
--json prints the overview as the server answers it, for a script or an agent.
The queue
The queue is in the order the server starts runs. When a place frees up, the first run in it whose owner has a place of their own left starts, so one caller with many runs does not keep the others waiting (see Limits and restarts). Each run in the queue says how long it has waited and what holds it, the first that applies:
| Waits for | What it means | What helps |
|---|---|---|
| your limit of running runs | You have runs.limits.running runs executing. A free place would not start it. | Wait for one of yours, or stop it with remote stop. |
| its sandbox | Another run works on the same sandbox, which runs one at a time. | Wait for that run. |
| a run that holds what it needs | On Kubernetes, runs of one caller that share kept claims run one at a time, see Namespaces. | Wait for that run. |
| no free place | Every place of runs.maxConcurrent is taken. | Wait; the operator may raise runs.maxConcurrent. |
A run that waits for an approval is not in the
queue yet: it is listed under waiting for an approval with the accounts it still needs and
when it is rejected without an answer. Its wait in the queue counts from its approval.
places counts the places taken. A service run takes one while it starts and gives it back
once it is up. A line N taken by no running run means the server counts a place that no
run holds, which is a fault worth reporting with the output of remote status --json.
Your limits
| Line | Counts | Its limit |
|---|---|---|
running | Your runs that execute, service runs while they start | runs.limits.running |
queued | Your runs in the queue, and service runs that are waking | runs.limits.queued |
approval | Your runs that wait for an approval | runs.limits.waiting |
services | Your service runs that are starting or up, one place per name: a newer run of a name replaces the older one; one that sleeps takes none and asks for one when it wakes | runs.up.limits.up |
asleep | Your service runs that sleep, one per name | runs.up.limits.asleep |
A submit over queued or approval is answered 429 and says which; over services or asleep too.
A run that ended counts against nothing.
Service runs and past runs
hammerkit remote services lists the service runs that are starting, up or asleep: yours,
and those of others you may see, with their addresses (where you may open them) and when they
end or sleep. --ended adds the ones that ended, as long as the server keeps them.
hammerkit remote runs lists your runs, newest first, as many as the server keeps
(runs.keep, 200 by default), each with how long it waited for a place and how long it ran
(a service run: until it was up). A queued run says where it stands and why it waits.
| Option | What it does |
|---|---|
--state <states> | Only runs in these states, comma separated: awaiting-approval, queued, running, up, asleep, succeeded, failed, cancelled, rejected. |
--services, --tasks | Only service runs, or only runs of tasks. |
--all | Also the runs of others you may see, each with its owner, see Who sees what. |
--limit <count> | Show more than 20. |
Read the log of one with remote logs: what its tasks
printed, what its services printed under their names, and the server's own lines under
hammerkit.
Past tasks
hammerkit remote tasks sums up, per task and repository, the runs the server keeps: how often
it ran, failed and came from the cache, what it took the last time, the median and the 90th
percentile of the times it executed (a task from the cache does not count), and how long its
runs waited for a place. --mine counts only your runs, --since 7d only the runs of the last
7 days; --since and --until also take a time, such as 2026-11-01T08:00:00Z. --json prints
it as the server answers it.
$ hammerkit remote tasks
test  github.com/corp/shop  last succeeded 2026-11-07T10:12:40.000Z took 2m 41s  37 runs, 3 failed, 12 cached  median 2m 30s, 90% 3m 5s, waited 12s
e2e  github.com/corp/shop  last failed 2026-11-07T09:58:02.000Z took 8m  9 runs, 2 failed  median 7m, 90% 9m, waited 1m 40s
The run page of the dashboard shows the same median beside each task, as Usually.
Capacity
hammerkit remote capacity shows what the machines of the server have and what the runs
take of them, CPU in cores and memory:
$ hammerkit remote capacity
capacity: 3 nodes with 12 CPU, 45 GiB, 4.1 CPU, 19 GiB in use
  runs: 14 pods, requested 5.25 CPU, 11 GiB, in use 2.8 CPU, 7.4 GiB
  hk-3fa2c1e09b7d4a55  caller of alice  6 pods  requested 2.5 CPU, 5 GiB of 8 CPU, 16 GiB  in use 1.2 CPU, 3.1 GiB
  hk-91c0d7be5e2f3a18  service run of bob run_Vd1rX9pQ2mT7wN4a  2 pods  requested 0.5 CPU, 1 GiB of 2 CPU, 4 GiB  in use 0.1 CPU, 600 MiB
On Kubernetes a line per namespace of the server, a caller's or a service run's: what its
pods requested of the scheduler, the quota the server set on it (backend.quota,
runs.up.quota) and what the pods use now. Requests and the quota need nothing more. What pods
use comes from the metrics API (metrics-server, which GKE, EKS and AKS run), and the nodes from
listing them; give the server these rules for both, or the output says what it could not read
and shows the rest. What the cluster answered is shown to an observe entitlement; others are
told that some of it could not be read. A read that takes longer than 3 seconds is not waited
for: the next look shows it.
# in hammerkit-runs, bound by the server in its namespaces: what the pods use
- { apiGroups: [metrics.k8s.io], resources: [pods], verbs: [list] }
# in hammerkit-server, optional: the nodes, what they have and use
- { apiGroups: [''], resources: [nodes], verbs: [list] }
- { apiGroups: [metrics.k8s.io], resources: [nodes], verbs: [list] }
On a host, the machine of its docker daemon: its CPUs and memory, the memory in use and the load when the daemon runs on the server's own machine, and what the containers of runs use.
The server reads it at most every 15 seconds. Everyone with an entitlement sees the totals;
whose a namespace is, its owner and observe see.
Who sees what
Everyone sees their own runs in full. What a caller sees of the runs of others depends on
runs.activity in the server's config:
everyone(the default): a caller with abuildslevel sees the runs of others in the repositories they have access to, those of theirreposand of theirsandboxes: whose a run is, what it runs (its tasks or services), its source, its state, where it waits, how long it waited and ran, and how long each task took. Not its arguments, what its tasks run, why it failed, its log, or the addresses of its endpoints. Who may only open endpoints or read checks (a preview reviewer, a CI job) sees none of it, and a run of uploaded files, which has no repository, is for its owner and who is involved.involved: a caller sees only the runs of others they are involved in, below.
Whatever runs.activity says, a caller also sees:
- the runs that wait for an approval of an account they
use: they decide about them, and read them whole, with their plan and their log; - the service runs of a repository whose endpoints they may open (an
endpointslevel), with their addresses; - every run whole, with its log, with
observe: trueon one of their entitlements.
A run a caller may not see counts in the totals and stands in the queue as
a run of somebody else, with no id, owner or task; a run that holds one of yours is named
only when you may see it.
observe is for the people who run the server and need to see why the queue is stuck or why
a run failed:
entitlements:
  - group: { iss: https://login.example.com, name: platform }
    observe: true
It only shows. It stops, extends and approves nothing, and runs nothing.
Dashboard
The same in a browser: a server with endpoints
and a browser sign-in (endpoints.login) serves a dashboard at https://hammerkit.<domain>,
for example https://hammerkit.run.example.com. Opening the address of the server itself in a
browser goes there too, and hammerkit remote dashboard prints it.
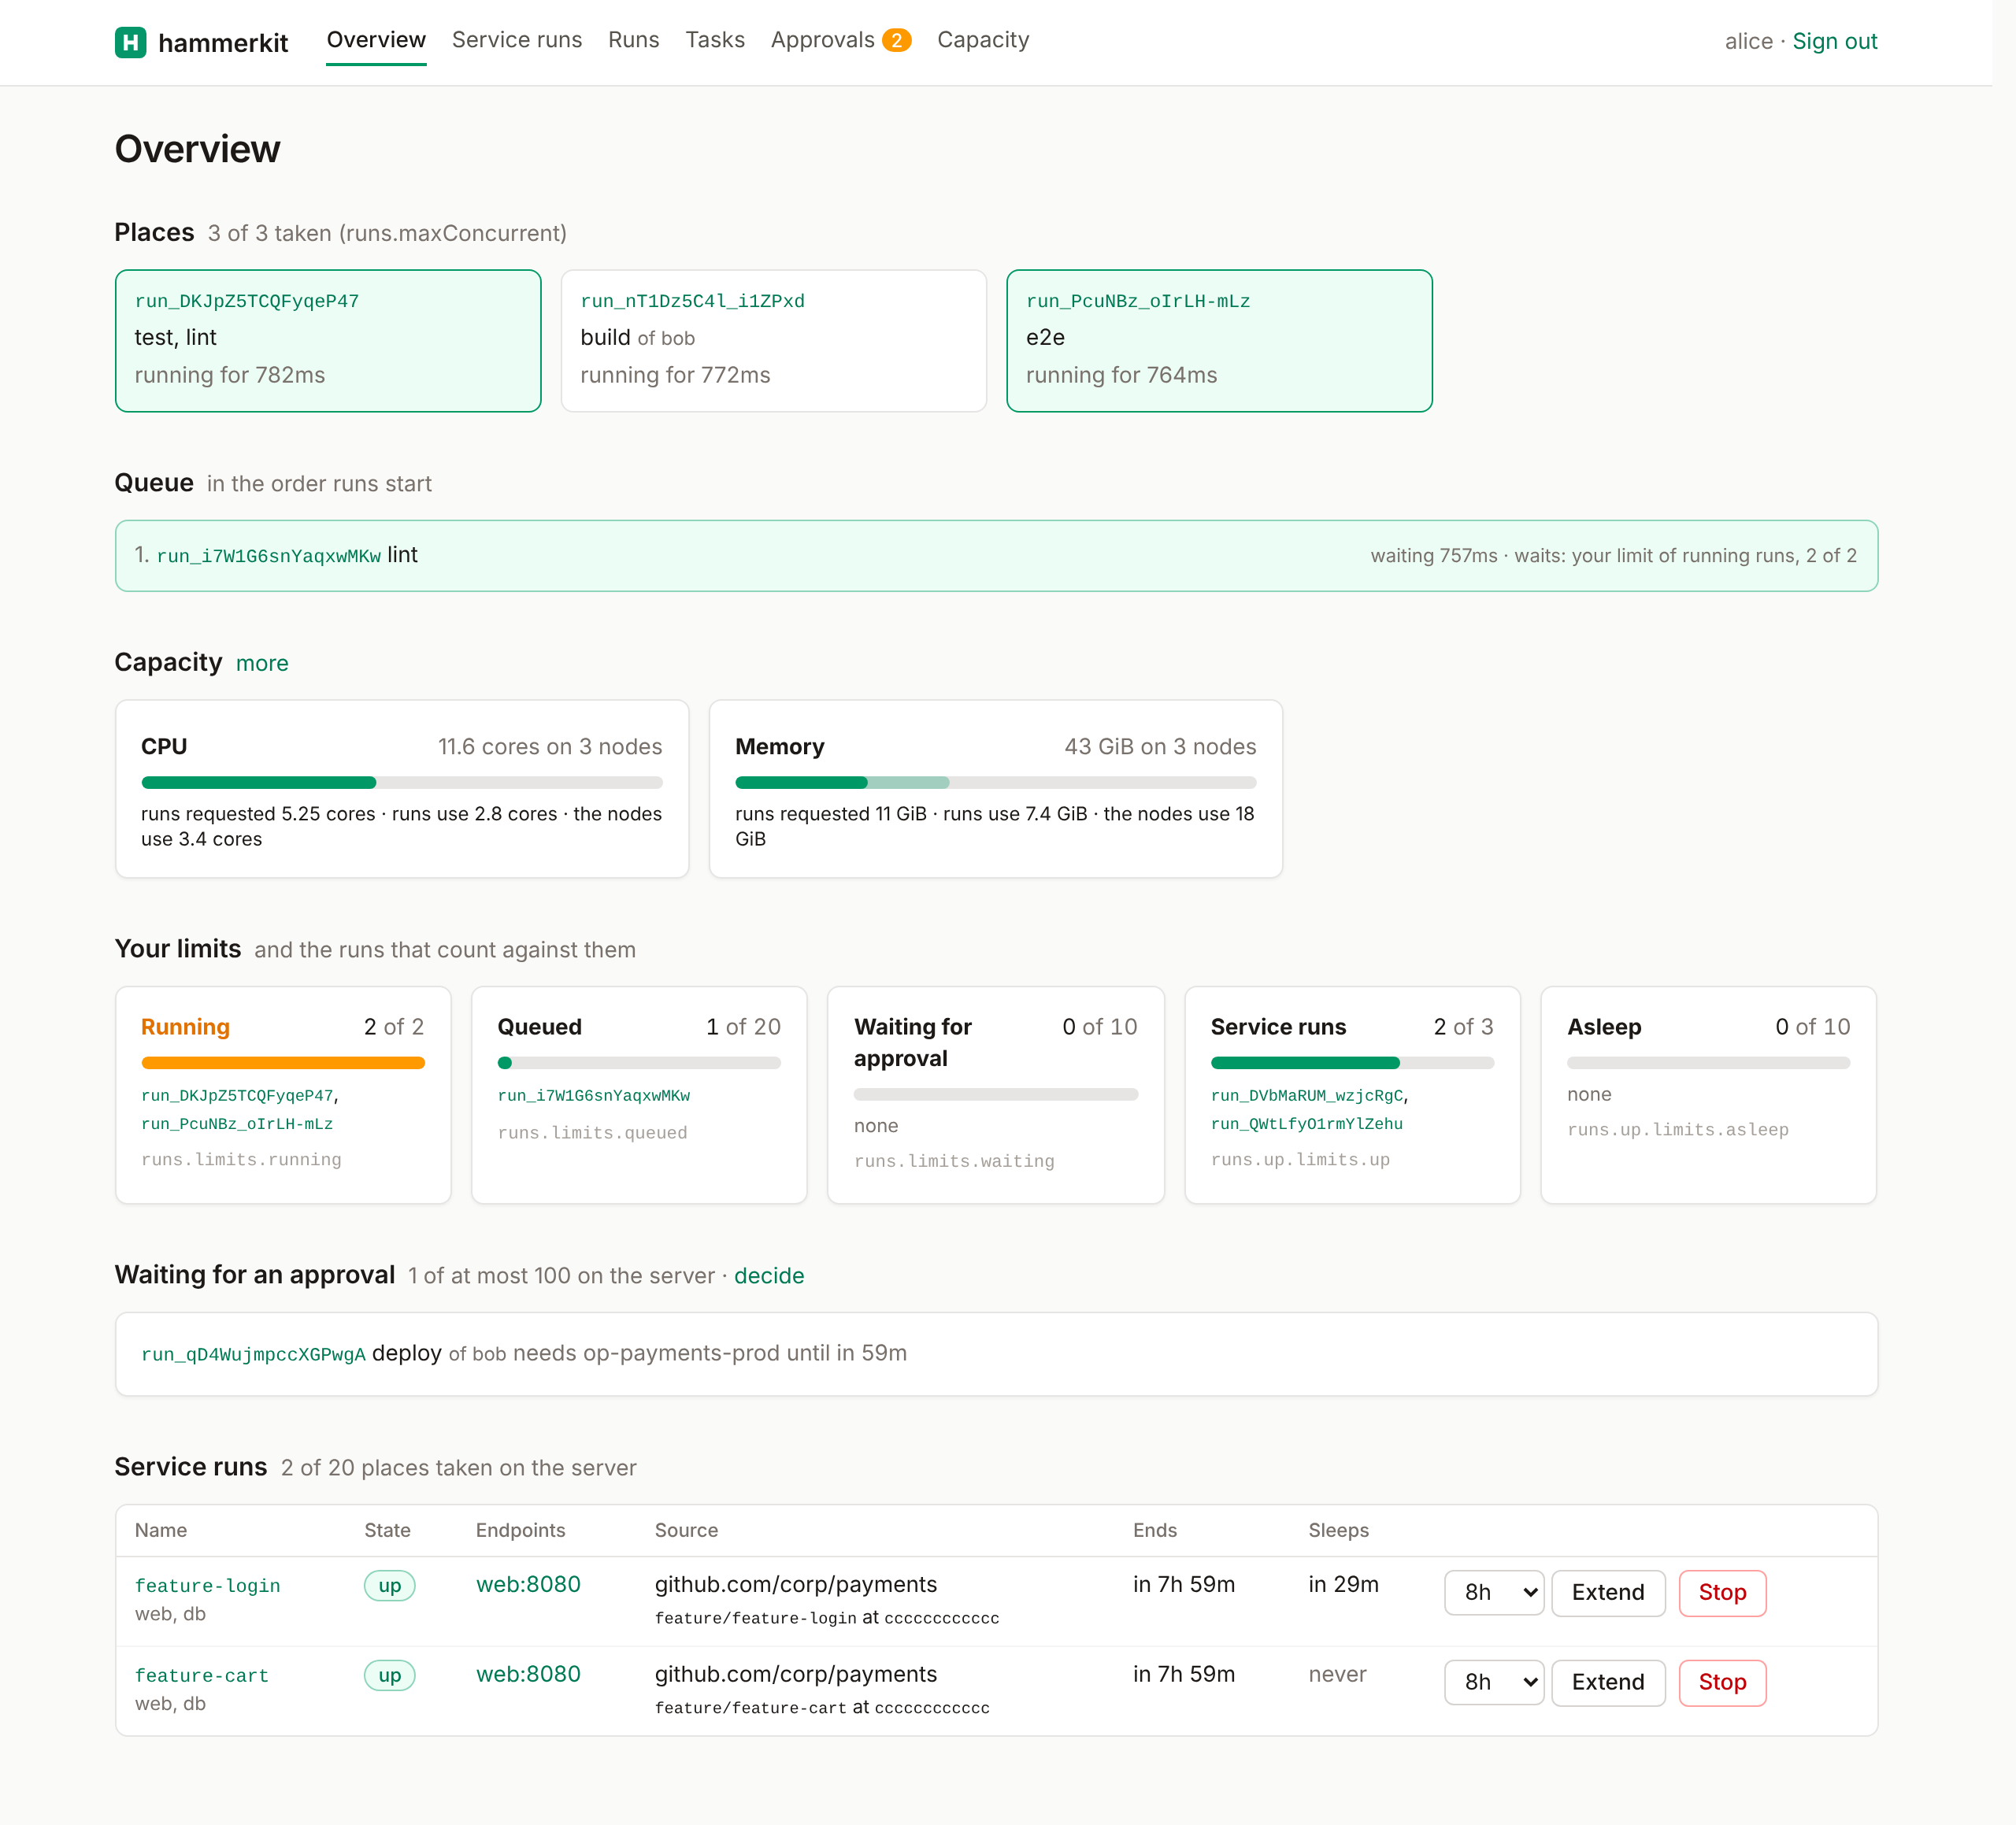
| Page | What it shows |
|---|---|
| Overview | What remote status prints: the queue with how long each run has waited and why (only while runs wait), the capacity: CPU and memory as requested of the total, and its active resources, the runs (their tasks or services, repository and owner) and sandboxes that take the most first, with what they requested and use (on Kubernetes), and in a few words why a total or what runs use is not known. The service runs are on Services. |
| Services | The service runs that are starting, up or asleep, then those that ended in the last day, by repository as on Tasks, narrowed by text (service, ref, build file, person) and by state, source and user, as on Runs. A run shows its state mark (a click opens the run), its services, each a link to its endpoint where you may open it, with its state below; its branch and commit with its build file below; and when it started and by whom (when it sleeps and ends on hover). Where you may, a button keeps a run up for longer, a triangle wakes one that sleeps, and a square stops it. |
| Tasks | What remote tasks prints, by repository, over the last hour, day, 7 days (by default), 30 days, a range from and to a time, or all the runs the server keeps, with the build file each task ran from the last time (a link to its page and its hash) and how often it came from the cache and succeeded, sortable by each column, and narrowed as you type by a task, a build file or a repository, and by source with the filter below the search, as on Runs. |
| Runs | The runs of everybody you may see, newest first, over the same periods as Tasks (7 days by default), with their state, how long they took in all (what they waited for a place and ran on hover), and when and by whom they were created, narrowed as you type by a task, a service, a branch, a person or an id, and by state, source and task with the filters below the search. A run that waits for an account you use is marked your approval. |
| A run | Its state, and Approve or Reject (with a reason) when it waits for an account you use; a retry button (an arrow in a circle) on a run that is over, which starts it again as a new run of yours and opens it, see Retrying a run; its source, build file and tasks; its owner, when it was created and its approvals; where it stands in the queue, how long it waited and ran; a graph of its tasks and services as a build file shows it, each in the color of how it went, with how many of its tasks came from the cache; a timeline of where its time went since it was submitted: a line of the run itself with its phases (the queue, the checkout, the namespace, the plan, and the cache check, where the keys of the tasks are computed from their files), then a line per task and service with its steps in colors: what it waited for (the queue for a task that depends on nothing, else its dependencies), the setup of its pod (scheduled, image pulled, caches restored and stored) and when its commands ran (in the color of how it ended), a task taken from the cache a marker at the moment it was, with the totals of each above, each moment counted once when tasks run side by side; the services it brings up, then its tasks in the order they run, those still to come too, each with how long it took and the tasks and services it waits for, and what each does (its image, commands, dependencies and secrets, from the run or, for who may see build files, from its build file). A click on a task in the graph opens it in a panel beside the page: how it went and why it was not cached, what it does whole (its commands, sources, what it generates, its secrets, accounts, network, what it runs after and what runs after it, each a click away), and for who may read the run whole its log. Who may read it whole also sees its arguments, why the tasks failed, and, in a Log tab next to Command when a task or service opens below it, the last 200 lines of its log (one that failed opens by itself, one that runs keeps following). |
| Log | All of the log of a run, a thousand lines a page, of all or of one task or service, a text to look for with the lines around it, and download as a text file. |
| Build files | The versions of build files by repository (as the repo annotation of the publish names it), each with its state: published, yanked, waiting for somebody who may publish (marked your approval when that is you), or rejected or expired in the last day; with their path, commit, tasks, and who published or proposed them when. A proposed version opens to the graph of its tasks and services, as a build file does (with its toggles per build file), and every file, with Publish or Reject for who may; nobody decides about their own, as with proposals. |
| A build file | One published version, in three tabs. Info: its path in the repository, hash, who published it, its repository and commit, accounts; for a version that names its repository, what the runs of its tasks in the last 7 days add up to (task runs, how many came from the cache, how many passed, the time they ran); and a table of its tasks and services with the build file that declares each, what each waits for and, from those runs, how often it ran, came from the cache and passed and its median time. Graph: its services in rows on top and its tasks below, laid out from left to right in the order they run with an arrow from what a task depends on to it; the arrows to a service show while it or a task that needs it is hovered or opened, a number on a task says how many services it needs, each box how often it came from the cache, and a dot what to look at, such as a local task or a host port. Below it, a toggle per build file hides the tasks and services it declares (a version published before the plan named the build files groups them by the prefix of their include). Files: its files as they are. A click on a task or service in the table or the graph opens what it does whole in a panel beside the page, with its runs of the last 7 days. For who may see build files (a builds level, an account, or observe). |
| Sandboxes | Your sandboxes by repository, with how many you have and the space they take against your limits, the branch and commit of each, what it pushed, its size, when it was last used, and the run that works on it now, and Delete (once asked: a run on it stops, what was not pushed is gone). Nobody else sees them. |
| A sandbox | Its repository, branch, commit, size and run, and what changed in its files since the commit: each file with the lines added and removed, and the diff, and Delete. The page does not change or push a sandbox. |
What changes is read again every 10 seconds, without reloading the page: a reason being typed for a reject stays.
Nothing more needs setting up: the dashboard signs people in the way an endpoint does,
through login.<domain>, with the redirect URI already registered, and sets a cookie for its
own host only. Who signs in needs an entitlement on the server, and sees what
Who sees what says, checked with the entitlements of the moment on every page.
The groups and claims of a person are the ones of their sign-in, for as long as the session
holds (endpoints.session, 8 hours by default): somebody taken out of a group at the issuer
keeps what the group gave them to look at and to stop or extend until they sign in again.
Approve, Publish, Reject and the retry button take a sign-in of the last 15 minutes
(a retry starts a run with the accounts your groups give you): an older one
shows Sign in again, which goes through login.<domain> and back with the groups of now (at
an issuer that still knows the person, without a password). A decision is logged with its
reason, as one through the API.
Stop is for the owner and who decides about a run, Extend for the owner of a service run
and who may open its endpoints. Retry is for who may read the run whole and may run from its
repository (a run on a sandbox: its owner); the new run is theirs, decided with their
entitlements as a run they start. An observe entitlement alone sees every run and changes
none.
The dashboard is an app of the server (React), which reads and does everything through the
API as the person who signed in: its host passes /api/v1/... on to /v1/... for
what the pages read and the buttons do, and refuses the rest (starting runs other than a retry,
publishing, sandboxes). So it shows what the command line shows, with the same rules. Its pages load
nothing from anywhere else, run no inline script, and no other site may frame them. What the
buttons send carries a token of the person and of their sign-in, which ends with it; a request
from another site, or from an endpoint of the same domain, is refused. To switch the dashboard
off, set endpoints.dashboard: false; to put it at another host, name it there
(dashboard: status for https://status.run.example.com).
--json of remote status and the API below give the same to a script.
API
GET /v1/overview answers what remote status prints. A caller with no entitlement is
answered 403.
{
  "you": { "iss": "https://login.example.com", "sub": "alice", "observe": false },
  "places": {
    "max": 4,
    "used": 4,
    "runs": [{ "id": "run_a8Zt0pQw3mVx7yLc", "state": "running", "tasks": ["test", "lint"] }],
    "others": 1
  },
  "queue": [
    {
      "position": 1,
      "mine": true,
      "run": {
        "id": "run_f1Gh5jKl8zXc3vBn",
        "state": "queued",
        "tasks": ["deploy"],
        "queuedAt": "2026-11-07T10:05:02.000Z"
      },
      "waitsFor": { "type": "own-limit", "running": 2, "limit": 2 }
    },
    { "position": 2, "mine": false, "waitsFor": { "type": "place", "used": 4, "max": 4 } }
  ],
  "approvals": { "waiting": 1, "max": 100, "runs": [] },
  "services": { "open": 3, "max": 20, "runs": [] },
  "limits": {
    "waiting": { "used": 0, "limit": 10, "runs": [] },
    "queued": { "used": 1, "limit": 20, "runs": ["run_f1Gh5jKl8zXc3vBn"] },
    "running": { "used": 2, "limit": 2, "runs": ["run_a8Zt0pQw3mVx7yLc", "run_c2Lk9sDe4rTy6uIo"] },
    "services": { "used": 0, "limit": 3, "runs": [] }
  }
}
Runs are shown as GET /v1/runs lists them (shortened here): with queuedAt, startedAt,
finishedAt and, per task, timings (status, durationMs, cached); a run of somebody
else with its owner, without options, plan and error. waitsFor.type is
own-limit, sandbox or held (with the run that holds it, when you may see it),
place, or starting for a run that starts with the next look at the queue.
GET /v1/runs takes the same filters as remote runs:
| Parameter | What it does |
|---|---|
scope | mine (the default), visible (also the runs of others you may see) or all (every run, needs observe, else 403). |
state | One or more states, comma separated. |
kind | tasks or services. |
id | One run, as the list shows it: a run of somebody else that GET /v1/runs/<id> keeps for its owner and who decides about it. |
A queued run, in the list and in GET /v1/runs/<id>, carries where it stands:
"queue": { "position": 1, "waitsFor": { "type": "place", "used": 4, "max": 4 } }.
With observe, GET /v1/runs/<id> and GET /v1/runs/<id>/logs answer for every run.
A run carries what you may do with it, so a page shows only the buttons that
work: "may": { "stop": true, "extend": true, "decide": true }, with what you may not left
out (stop for its owner and who decides about it, extend for a service run that was up and
who may open it, decide for a run that waits for an account you use, retry for a run that
is over that you read whole and may run from where it ran). A run of somebody else
that GET /v1/runs/<id> answers you whole (you decide about it, or observe) is listed with
"readable": true. A listed run names where in its repository its build file is
(entry), next to its version (definition). GET /v1/runs/<id>/logs names what the log can be narrowed to with task: "names": ["build", "web", "hammerkit"], where hammerkit is the server's own lines.
GET /v1/tasks answers what remote tasks prints, over the runs you may see (scope=mine
for your own) and created in a period (since and until, each back from now such as 7d or a
time such as 2026-11-01T08:00:00Z; remote tasks --since --until):
{ "tasks": [{ "repo", "task", "runs", "succeeded", "failed", "cached", "last", "medianMs", "p90Ms", "totalMs", "medianWaitMs" }], "oldest" }, where oldest is when the oldest run it
counts was created, and last is how the task ran the last time (status, at, durationMs)
and from which build file: its version (definition) and its path in the repository (entry).
GET /v1/capacity answers what remote capacity prints: backend, machines (count,
allocatable, used, load), runs (requested, used, pods or containers),
groups (per namespace: name, kind, owner, run, pods, requested, quota, used),
uses (on Kubernetes, per run or sandbox, the most used first: kind run, sandbox or
other, run, tasks, up, repo, owner, pods, requested, used; of the runs of others
only what they take, but to an observe entitlement),
problems and unknown (total and used: why the total of the machines or what runs use
could not be read, in a few words, such as may not list nodes or no metrics API), CPU in
cores and memory in bytes.
Service runs
Keep services of a build file up on the server for a while, with their ports at addresses of their own behind the server's sign-in: for a person to check a change, a demo, or an agent to test against.
Sandboxes
Keep a checkout on the server, run published tasks on it, read, search and edit its files, push its changes to a branch, and the limits that keep sandboxes in check.